![]() B&U-Policy (2024) Tegneskole (2023) The strings of things (2023) Old Spice Font (2022) Green Spaces (2022) Technopanics (2022) AFS (2021) About
B&U-Policy (2024) Tegneskole (2023) The strings of things (2023) Old Spice Font (2022) Green Spaces (2022) Technopanics (2022) AFS (2021) About
B&U-Policy (2024) Tegneskole (2023) The strings of things (2023) Old Spice Font (2022) Green Spaces (2022) Technopanics (2022) AFS (2021) About
![]() Tegneskole (2023) The strings of things (2023) Old Spice Font (2022) Green Spaces (2022) Technopanics (2022) Groninger (2021) AFS (2021) About
Tegneskole (2023) The strings of things (2023) Old Spice Font (2022) Green Spaces (2022) Technopanics (2022) Groninger (2021) AFS (2021) About
Tegneskole (2023) The strings of things (2023) Old Spice Font (2022) Green Spaces (2022) Technopanics (2022) Groninger (2021) AFS (2021) About
(2022)
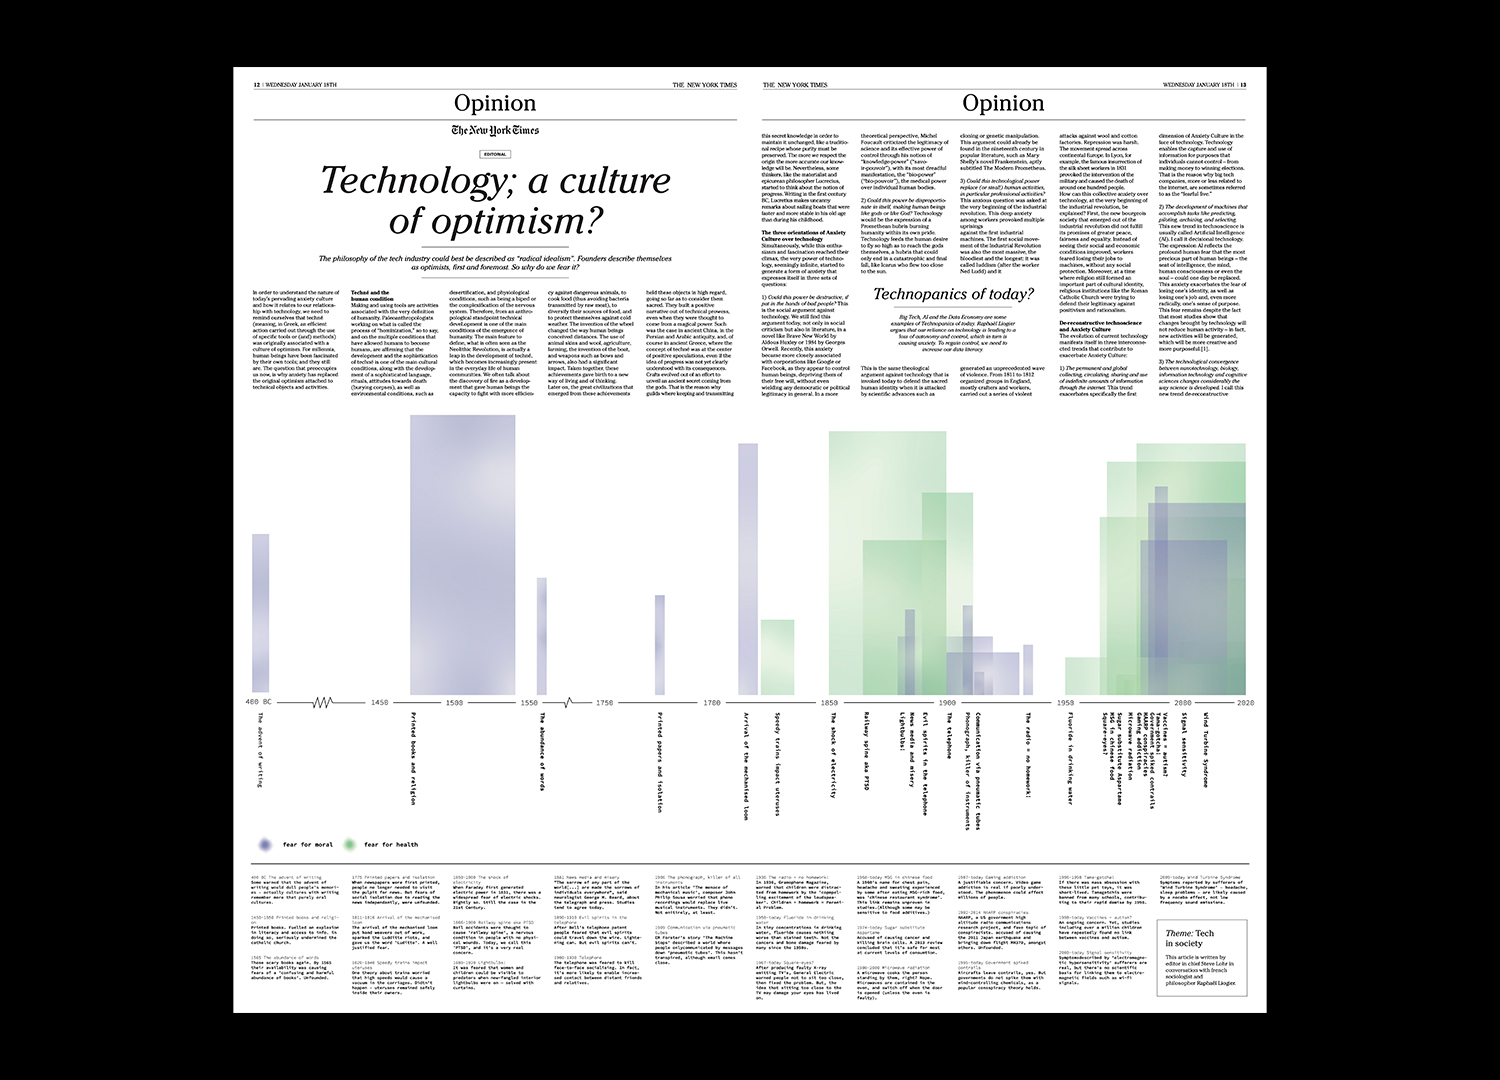
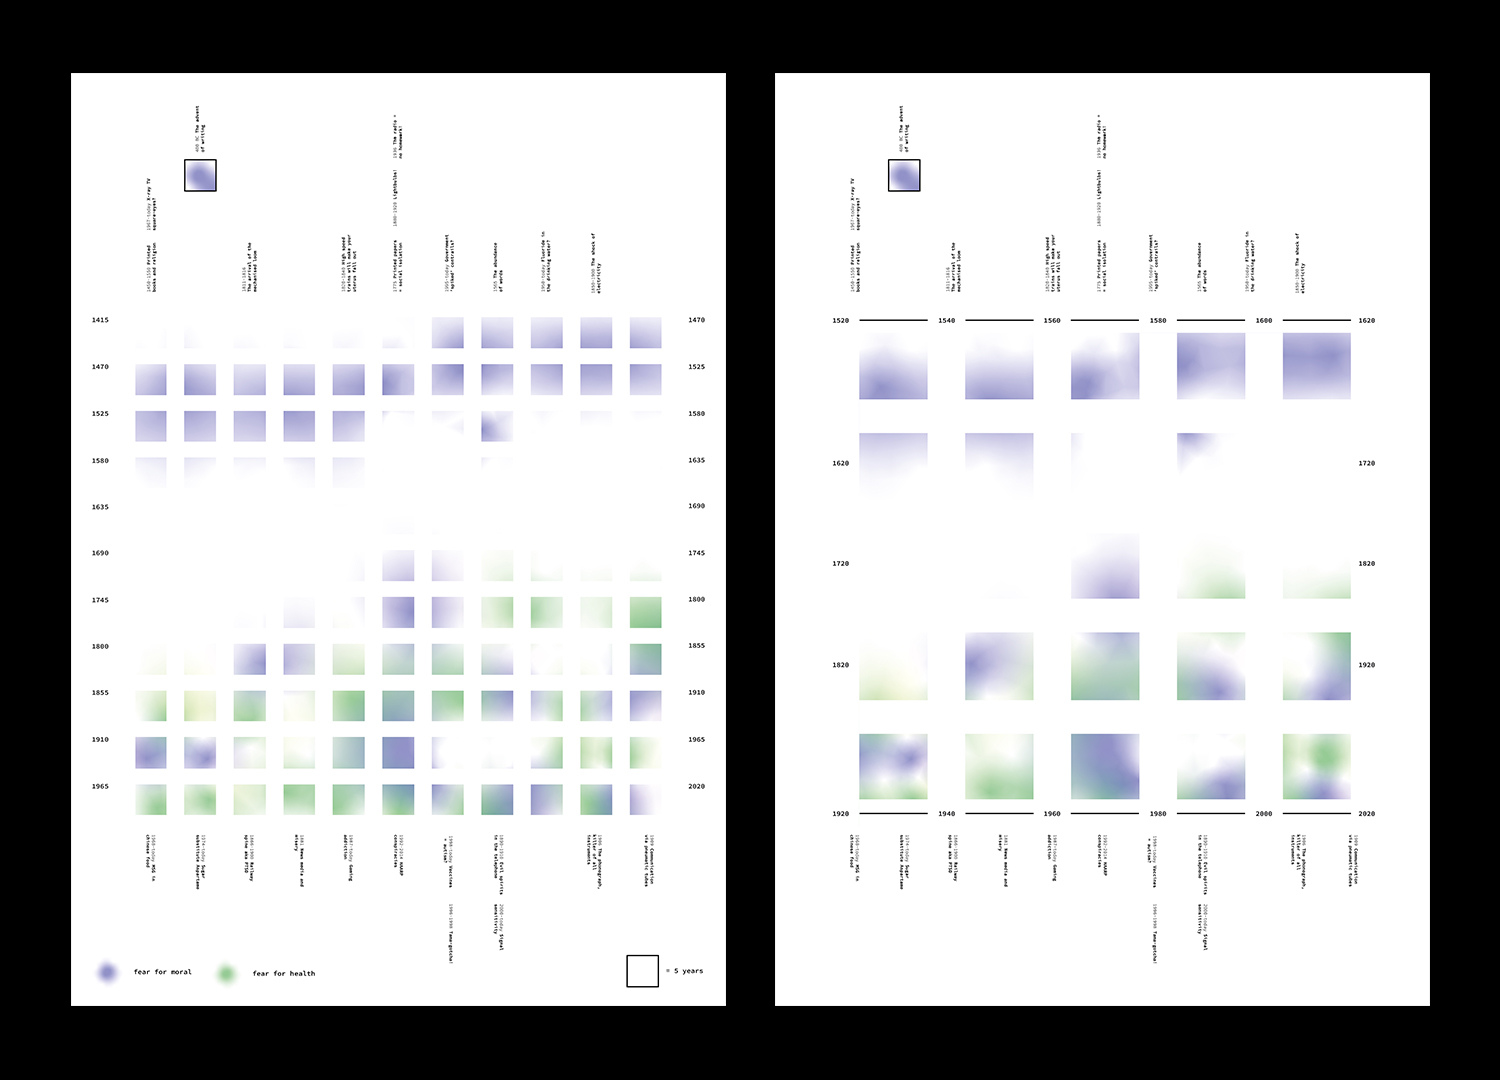
Technopanics
Does the optimismitic ways of Silicon Valleys tech enterpeneurs rub of on the users? Is tech really a culture of optimism? This visualization sheds light on the rise of new technology and how it often leaves a trail of fear for what unknown societal changes it may cause. The aim of the visualization is to use fear as a way to talk about values regarding tech and why this type of fear arise in the first place. The visualizations were made in the same period as the OpenAI ChatGPT was launched which led to an additional fear – namely the fear of chatbots being used to cheat at exams (a well discussed topic in Denmark at the time).
Proces
In the exploration of data visualization the assignment was to choose an existing data visualization and redesign it looking at the variables in form. How form is part of the perception of the data itself. The final output was to fit print in a newspaper of choice and so this visualization is designed for The New York Times.
This project was part made as of a masters course at The Royal Danish Academy Graphic Communication Design with Studio Joost Grootens.